# graph
## Usage
`prism graph` is used to render your project as a series of nodes and edges (i.e., a graph) and launch an interactive UI for visualizing this graph.
```
Usage: prism graph [OPTIONS]
Launch the Prism Visualizer UI to view your project as a graph. This is the CLI equivalent of calling
PrismProject.graph(...) in your Python script.
╭─ Options ────────────────────────────────────────────────────────────────────────────────────────────────────────╮
│ --project-id TEXT Project ID. │
│ --project-name TEXT Project name. │
│ --project-version TEXT Project version. │
│ * --tasks-dir TEXT Directory containing tasks. Default is the │
│ "tasks" folder in the current directory. │
│ [required] │
│ --port -p INTEGER Port used by the webserver for launching the UI. │
│ Default is 8000. │
│ --open-window Open the visualizer UI in a new window in your │
│ default web browswer. │
│ --hot-reload Update the project's graph after each local │
│ change │
│ --log-level -l [info|warning|error|debug|critical] Set the log level │
│ --help Show this message and exit. │
╰──────────────────────────────────────────────────────────────────────────────────────────────────────────────────╯
```
The CLI arguments are largely the same as the arguments used to instantiate the [`PrismProject`](https://docs.runprism.com/fundamentals/prismproject-api) and call the [`PrismProject.graph()`](https://docs.runprism.com/fundamentals/prismproject-api/prismproject-.graph)method. However, note that the CLI command ignores `connectors`, `callbacks`, `concurrency`, and `package_lookups`. These inputs do not affect the `graph` command's behavior.
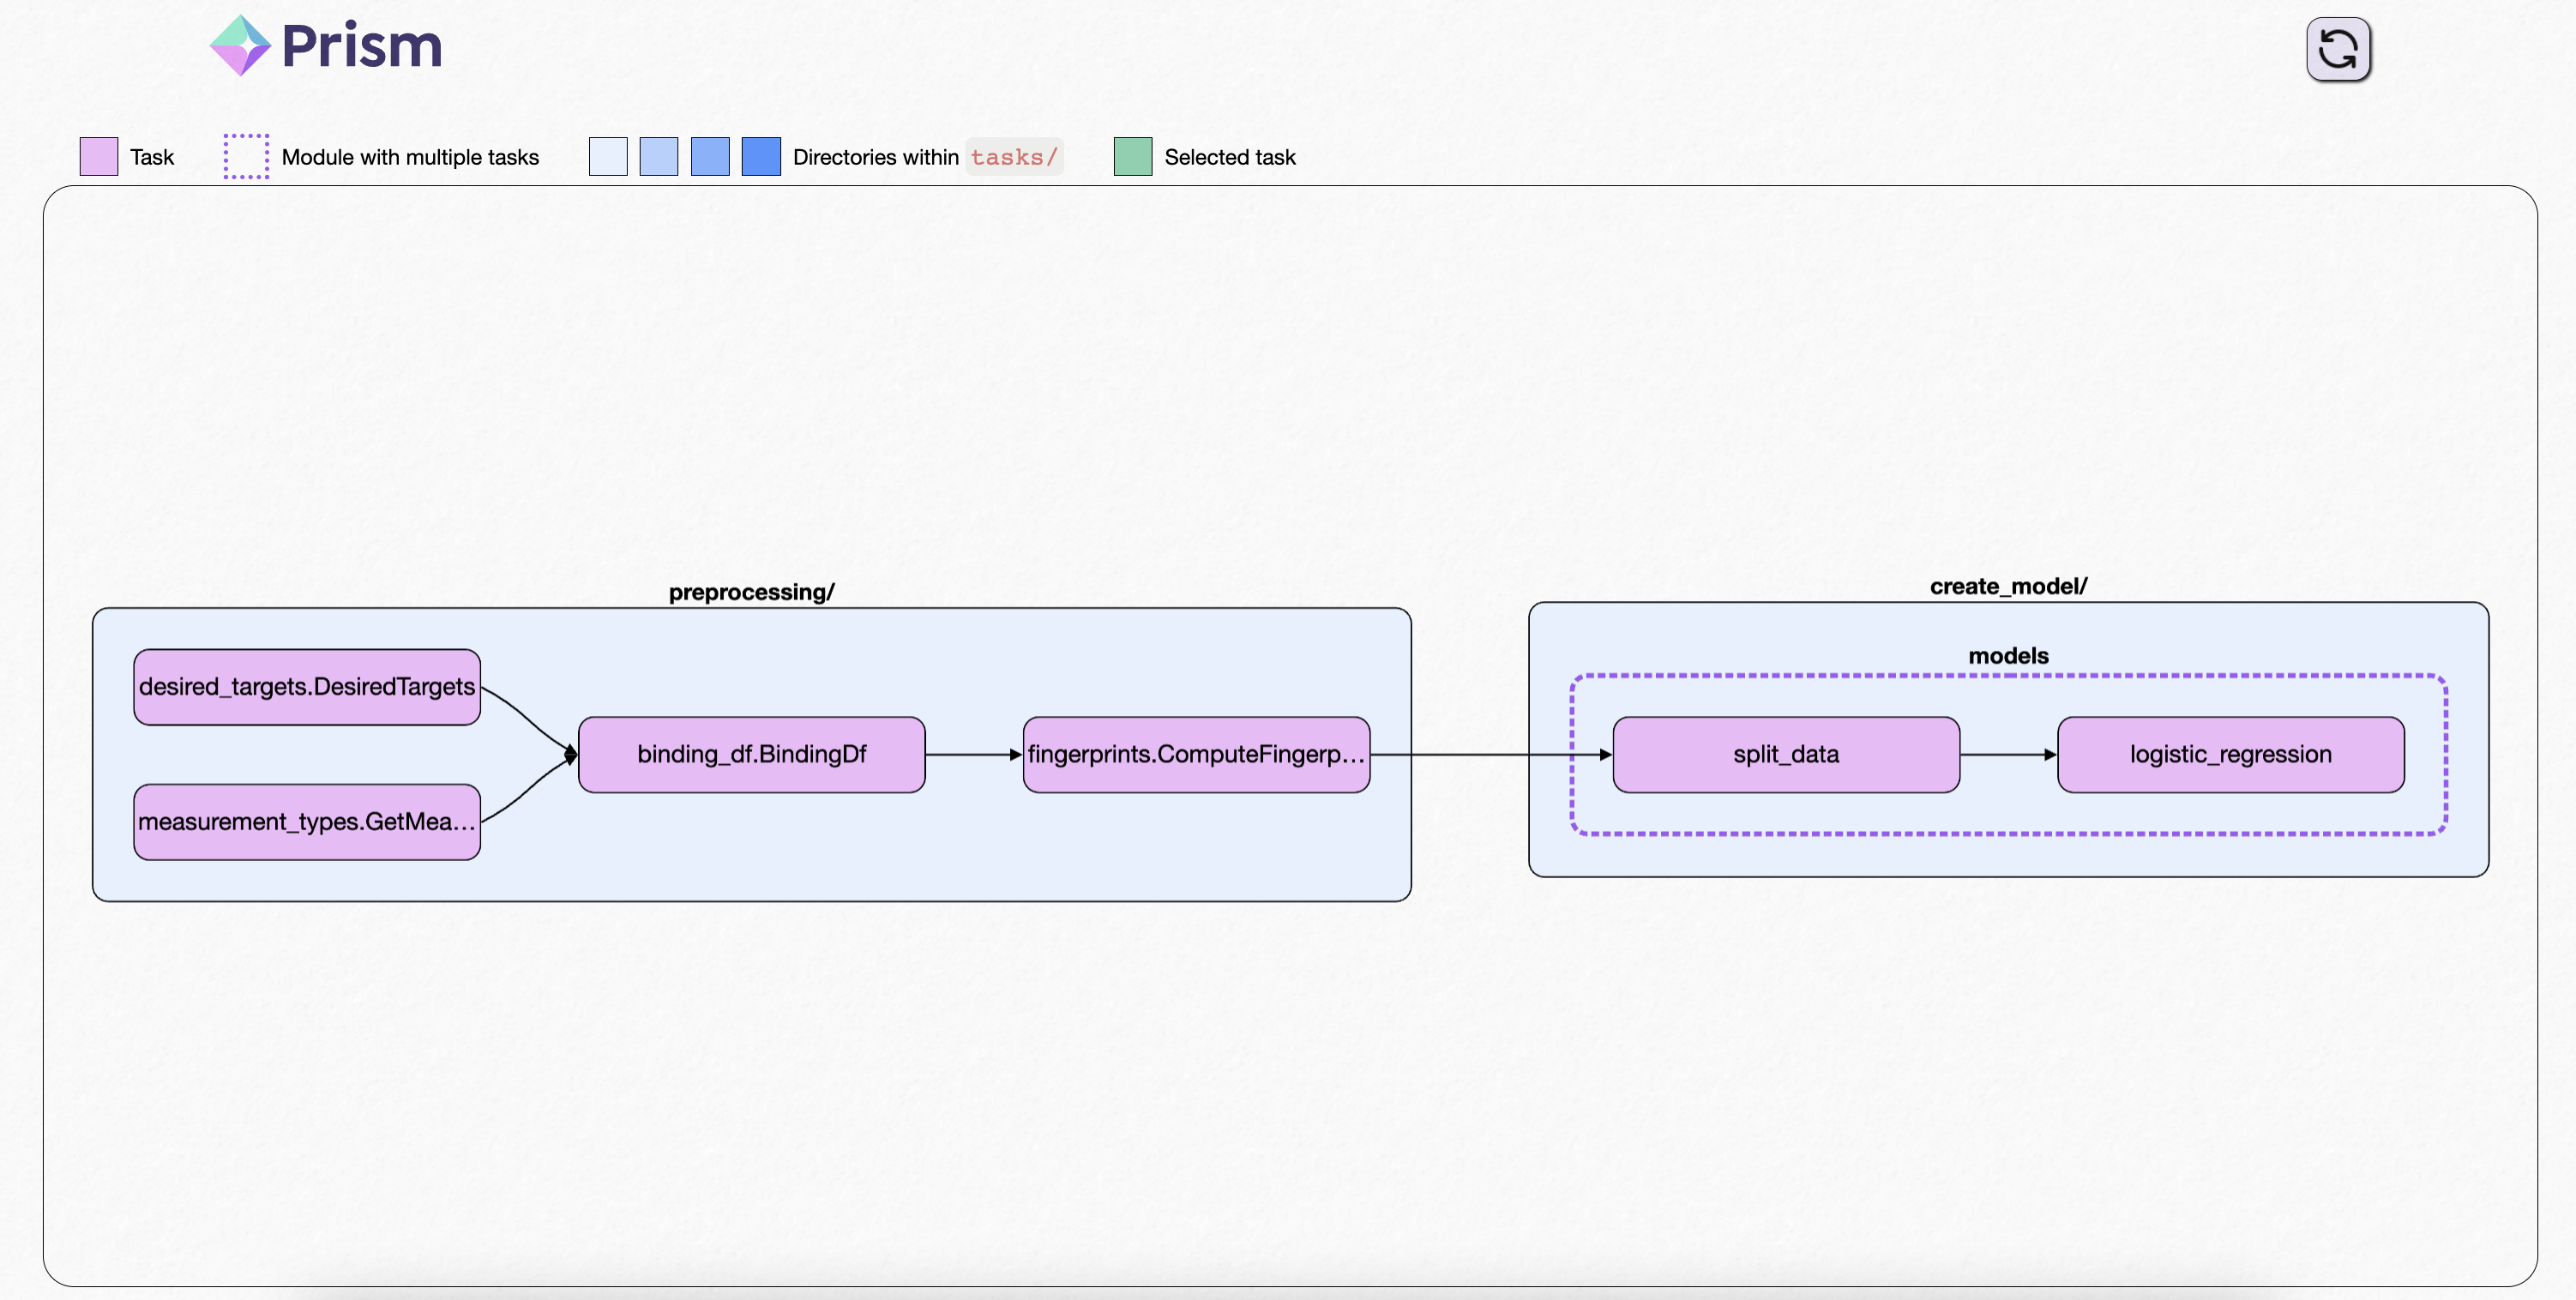
## Example
Here's what an example project looks like:
---
# Agent Instructions: Querying This Documentation
If you need additional information that is not directly available in this page, you can query the documentation dynamically by asking a question.
Perform an HTTP GET request on the current page URL with the `ask` query parameter:
```
GET https://docs.runprism.com/cli/graph.md?ask=
```
The question should be specific, self-contained, and written in natural language.
The response will contain a direct answer to the question and relevant excerpts and sources from the documentation.
Use this mechanism when the answer is not explicitly present in the current page, you need clarification or additional context, or you want to retrieve related documentation sections.